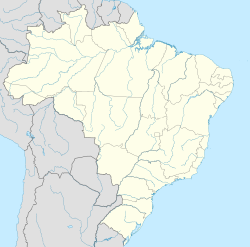
Jaboticabal
Jaboticabal | |
|---|---|
 Location in São Paulo state | |
| Coordinates: 21°15′17″S 48°19′20″W / 21.25472°S 48.32222°W | |
| Country | Brazil |
| Region | Southeast |
| State | São Paulo |
| Mesoregion | Ribeirão Preto |
| Microregion | Jaboticabal |
| Government | |
| • Mayor | José Carlos Hori |
| Area | |
| • Total | 707 km2 (273 sq mi) |
| Elevation | 605 m (1,985 ft) |
| Population (2020 [1]) | |
| • Total | 77,652 |
| • Density | 110/km2 (280/sq mi) |
| Time zone | UTC-03:00 (BRT) |
| • Summer (DST) | UTC-02:00 (BRST) |
| Website | Official website |
Jaboticabal is a municipality in the state of São Paulo in Brazil. The population is 77,652 (2020 est.) in an area of 707 km2.[2] The town takes its name from the jabuticaba tree.
Jaboticabal is home to the UNESP university campus, and is also the city that produces the most peanuts in Brazil. Around the city are extensive sugar cane plantations and industries making Jaboticabal one of the most important cities in agrobusiness around its region.
Economy[edit]
The municipality is located in one of the richest regions in São Paulo State, SE Brasil, responsible for approximately 8.5% of its gross domestic product (GDP).
Climate[edit]
| Climate data for Jaboticabal (1981–2010) | |||||||||||||
|---|---|---|---|---|---|---|---|---|---|---|---|---|---|
| Month | Jan | Feb | Mar | Apr | May | Jun | Jul | Aug | Sep | Oct | Nov | Dec | Year |
| Mean daily maximum °C (°F) | 30.1 (86.2) |
30.7 (87.3) |
30.2 (86.4) |
29.2 (84.6) |
27.0 (80.6) |
26.0 (78.8) |
26.8 (80.2) |
28.8 (83.8) |
30 (86) |
30.8 (87.4) |
30.8 (87.4) |
30.1 (86.2) |
29.2 (84.6) |
| Daily mean °C (°F) | 24.3 (75.7) |
24.3 (75.7) |
23.9 (75.0) |
22.6 (72.7) |
20.1 (68.2) |
18.6 (65.5) |
18.8 (65.8) |
20.7 (69.3) |
22.3 (72.1) |
23.8 (74.8) |
24.2 (75.6) |
24.1 (75.4) |
22.3 (72.1) |
| Mean daily minimum °C (°F) | 20.0 (68.0) |
19.9 (67.8) |
19.3 (66.7) |
17.5 (63.5) |
14.9 (58.8) |
13.0 (55.4) |
12.8 (55.0) |
14.1 (57.4) |
16.2 (61.2) |
17.9 (64.2) |
18.9 (66.0) |
19.6 (67.3) |
17.0 (62.6) |
| Average precipitation mm (inches) | 262.1 (10.32) |
210.1 (8.27) |
176.3 (6.94) |
79.8 (3.14) |
57.8 (2.28) |
28.8 (1.13) |
16.8 (0.66) |
29.2 (1.15) |
58.1 (2.29) |
133.8 (5.27) |
160.7 (6.33) |
230.8 (9.09) |
1,444.3 (56.86) |
| Average precipitation days (≥ 1.0 mm) | 17 | 13 | 12 | 7 | 5 | 3 | 2 | 3 | 6 | 9 | 10 | 15 | 102 |
| Average relative humidity (%) | 79.1 | 77.3 | 76.9 | 73.0 | 71.7 | 67.4 | 59.5 | 53.8 | 57.2 | 63.6 | 67.0 | 75.8 | 68.5 |
| Mean monthly sunshine hours | 190.5 | 183.9 | 204.1 | 229.8 | 224.5 | 218.8 | 248.5 | 242.9 | 198.3 | 217.0 | 220.7 | 189.9 | 2,568.9 |
| Source: Instituto Nacional de Meteorologia[3] | |||||||||||||
References[edit]
- ^ IBGE 2020
- ^ Instituto Brasileiro de Geografia e Estatística
- ^ "Normais Climatológicas Do Brasil 1981–2010" (in Portuguese). Instituto Nacional de Meteorologia. Retrieved 21 May 2024.


